State the null (\(H_0\)) and alternative (\(H_a\)) hypotheses
Specify the significance level, \(\alpha\)
Compute the test statistic \(t\) (critical value method)
Compute the \(p\)-value (\(p\)-value method)
State the conclusion
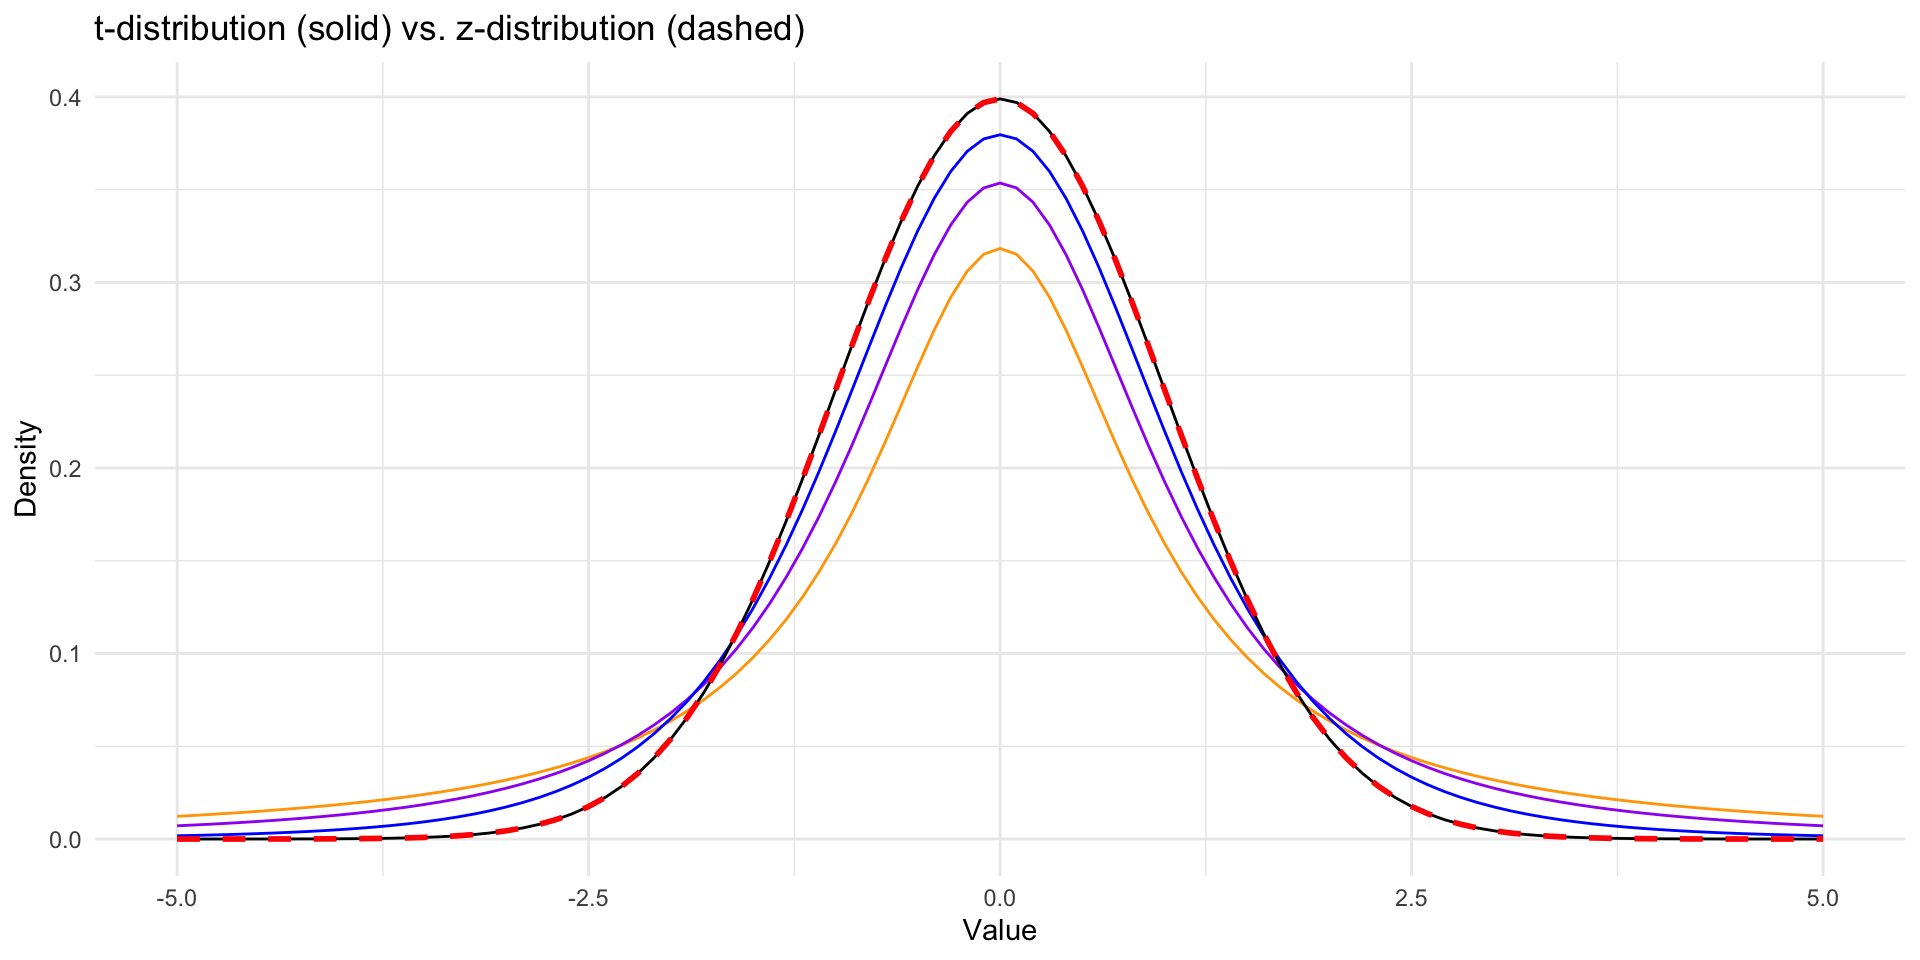
Types of \(t\)-Tests
One-sample \(t\)-test: verify a claim about the population mean
Two-sample \(t\)-test: compare two population means
Paired \(t\)-test: compare two population means with paired data
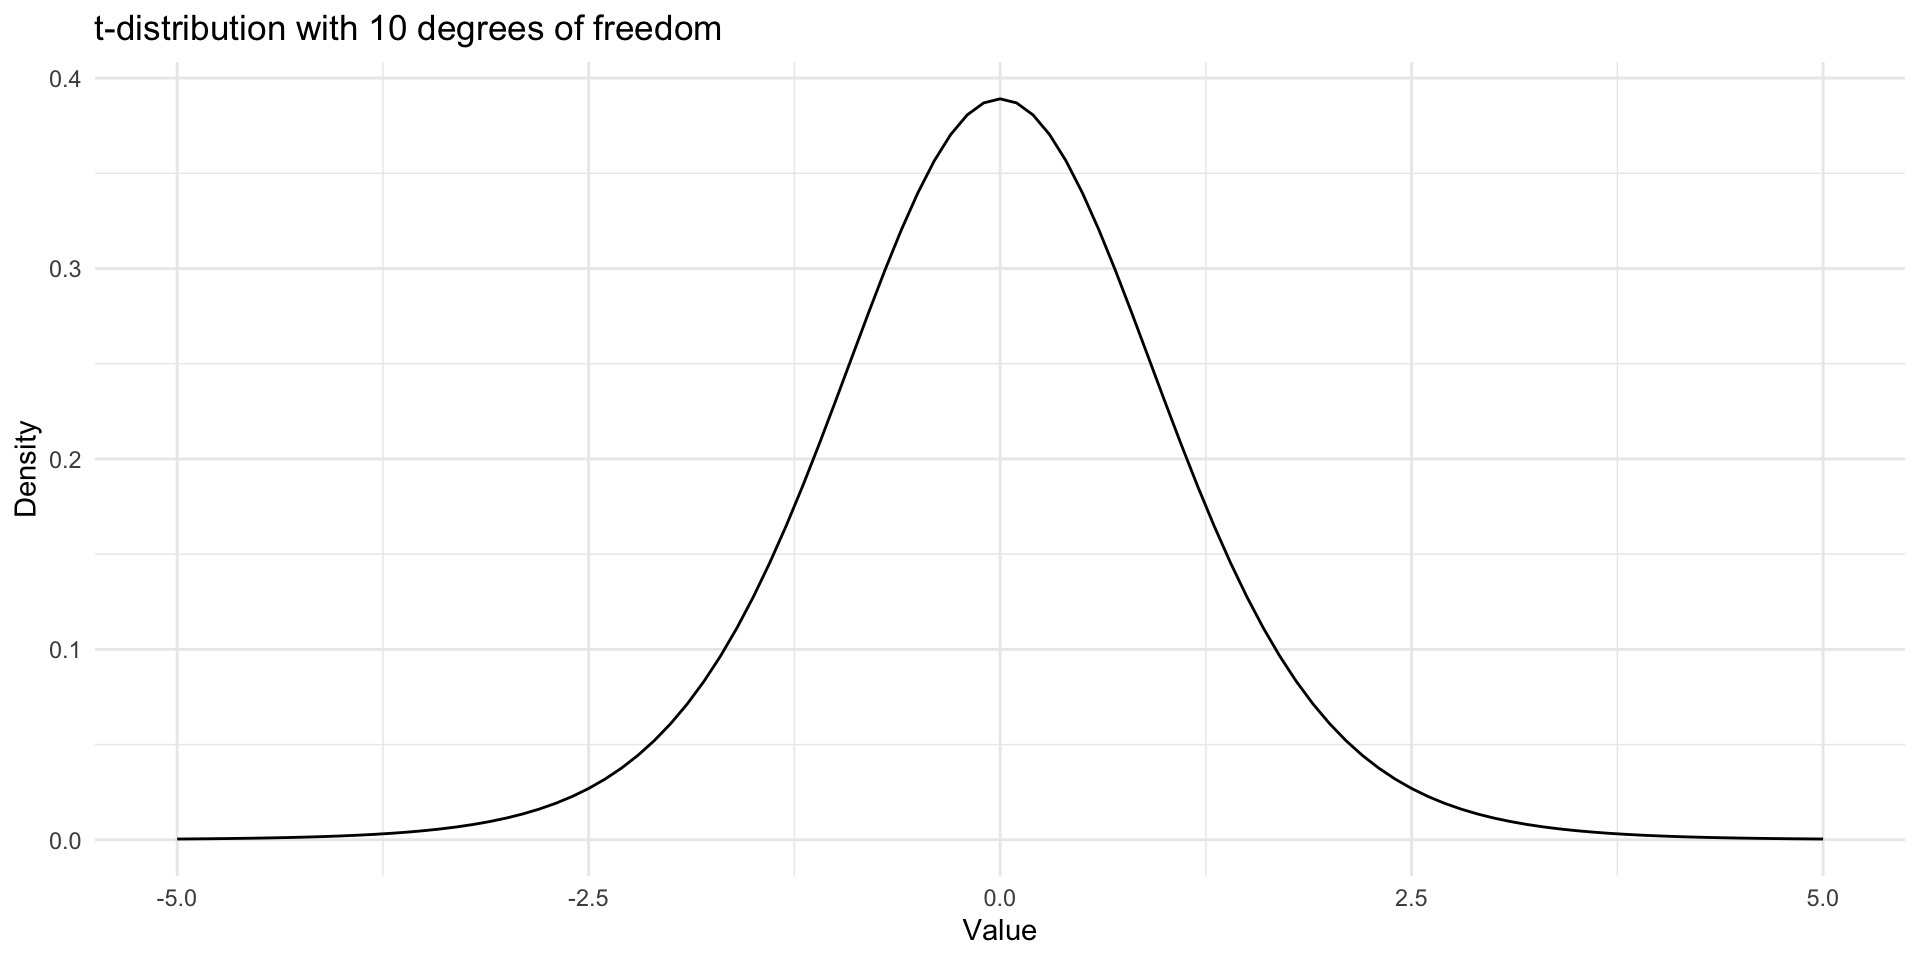
One-Sample \(t\)-Test
A computer software company claims that a new version of its operating system will crash fewer than six times per year on average. A system administrator installs the operating system on a random sample of 41 computers. At the end of year, the sample mean number of crashes is 7.1, with a standard deviation of 3.6. Can you conclude that the vendor’s claim is false? Use the \(\alpha = 0.05\) significance level.
\(H_0\): \(\mu = 6\)
\(H_a\): \(\mu > 6\)
One-Sample \(t\)-Test
x_bar =7.1s =3.6mu =6n =41t = (x_bar - mu) / (s /sqrt(n))t_cv =qt(0.95, n -1)p_value =pt(t, n -1, lower.tail =FALSE) # default is lower.tail = TRUElower_ci = x_bar - t_cv * s /sqrt(n)upper_ci = x_bar + t_cv * s /sqrt(n)print(str_glue("t = {round(t, 3)}, t_cv = {round(t_cv, 3)}"))
Since 1.957 > 1.684 and 0.029 < \(0.05\), we reject \(H_0\) and conclude that the vendor’s claim is false.
One-Sample \(t\)-Test
Suppose you have a batch of batteries, and the manufacturer claims that these batteries last an average of 300 hours. You want to test this claim by taking a sample of batteries and testing their lifespan. \[310, 298, 305, 280, 315, 290, 300, 305, 295, 320\]
Sample mean: 301.8, Sample standard deviation: 11.887
One-Sample \(t\)-Test
result =t.test(batteries, mu =300, alternative ="two.sided", conf.level =0.95)print(result)
    One Sample t-test

data:  batteries
t = 0.47887, df = 9, p-value = 0.6435
alternative hypothesis: true mean is not equal to 300
95 percent confidence interval:
 293.2969 310.3031
sample estimates:
mean of x
    301.8
We fail to reject \(H_0\) at \(\alpha = 0.05\) and conclude that there is no enough evidence to conclude that the mean lifespan of the batteries is different from 300 hours.
Pooled Variance
When the population variances are equal, we can pool the sample variances.
The pooled variance is a weighted average of the sample variances. \[s_p^2 = \frac{(n_1 - 1)s_1^2 + (n_2 - 1)s_2^2}{n_1 + n_2 - 2}\]
leveneTest from car package can be used to test the equality of variances.
A common rule of thumb is that if the largest sample standard deviation is not more than twice the smallest standard deviation, then the variances are considered equal.
Suppose you want to compare the average lifespan of two different brands of batteries. \[\begin{aligned}
\text{Brand A: } & 310, 298, 305, 280, 315, 290, 300, 305, 295, 320 \\
\text{Brand B: } & 295, 290, 285, 305, 290, 285, 280, 300, 295, 305, 292, 285
\end{aligned}\]
\(H_0\): \(\mu_A = \mu_B\) or \(\mu_A - \mu_B = 0\)
\(H_a\): \(\mu_A \neq \mu_B\) or \(\mu_A - \mu_B \neq 0\)
batteries_A =c(310, 298, 305, 280, 315, 290, 300, 305, 295, 320)batteries_B =c(295, 290, 285, 305, 290, 285, 280, 300, 295, 305, 292, 285)print(str_glue("Sample mean of Brand A: {mean(batteries_A)}, Sample mean of Brand B: {mean(batteries_B)}"))
Sample mean of Brand A: 301.8, Sample mean of Brand B: 292.25
print(str_glue("Sample standard deviation of Brand A: {round(sd(batteries_A), 3)}, Sample standard deviation of Brand B: {round(sd(batteries_B), 3)}"))
Sample standard deviation of Brand A: 11.887, Sample standard deviation of Brand B: 8.081
Two-Sample \(t\)-Test
result =t.test(batteries_A, batteries_B, alternative ="two.sided", var.equal =TRUE)print(result)
    Two Sample t-test

data:  batteries_A and batteries_B
t = 2.2361, df = 20, p-value = 0.0369
alternative hypothesis: true difference in means is not equal to 0
95 percent confidence interval:
  0.6411308 18.4588692
sample estimates:
mean of x mean of y
   301.80    292.25
We reject \(H_0\) at \(\alpha = 0.05\) and conclude that the mean lifespan of the batteries is different between the two brands.
Paired \(t\)-Test
You are testing the effectiveness of a new diet program. A group of individuals’ weights are recorded before starting the program and after completing the program.
before =c(181, 183, 175, 163, 192, 201, 196, 181, 207, 189)after =c(166, 163, 178, 180, 175, 166, 172, 176, 172, 172)print(str_glue("Sample mean of before: {mean(before)}, Sample mean of after: {mean(after)}"))
Sample mean of before: 186.8, Sample mean of after: 172
Paired \(t\)-Test
# right-tailed testresult =t.test(before, after, alternative ="greater", paired =TRUE)# left-tailed test# result = t.test(after, before, alternative = "less", paired = TRUE)print(result)
    Paired t-test

data:  before and after
t = 2.8892, df = 9, p-value = 0.008954
alternative hypothesis: true mean difference is greater than 0
95 percent confidence interval:
 5.40988     Inf
sample estimates:
mean difference
           14.8
We reject \(H_0\) at \(\alpha = 0.05\) and conclude that the mean weight before and after the diet program is different.
Questions
What if we have more than two groups?
How do we detect if there is a difference between the groups?