set.seed(42)
n = 1000
x = sample(1:6, n, replace = TRUE)
y = cumsum(x) / seq_along(x) # seq(1, 1000, 1)
df = tibble(x = 1:n, y = y)

ggplot(df, aes(x = x, y = y)) +
  geom_line() +
  geom_hline(yintercept = 3.5, linetype = "dashed") +
  ylim(0, 6) +
  theme_minimal() +
labs(title = "Expected Value of a Die Roll", x = "Number of Rolls", y = "Expected Value")Should you play Powerball?
What is the expected value of a lottery ticket?
Powerball Lottery
- Powerball is an American lottery game offered by 45 states.
- Since October 7, 2015, the game has used a 5/69 (white balls) + 1/26 (Powerballs) matrix from which winning numbers are chosen.
- Each play costs $2, or $3 with the Power Play option.
- It offers various prizes for matching one to five white balls or the Powerball itself.
- The jackpot could make winners instant millionaires.
Should you play Powerball?

- Don’t play Powerball.
- If you do play Powerball, don’t play Powerball unless the jackpot is really big.
- And if you buy tickets for a massive jackpot, try to reduce the odds you’ll have to share your haul; pick numbers other players won’t. Don’t pick your birthday. Don’t pick numbers that won a previous draw. Don’t pick numbers that form a nice pattern on the ticket. And for God’s sake, don’t pick numbers you find in a fortune cookie. (You know they don’t put different numbers in every cookie, right?)
Question
- How big does the jackpot have to be to make it worth playing?
Expected Value
- The expected value describes the average outcome or mean of a random variable over a large number of trials or occurrences.
- It provides a measure of the center of the probability distribution of a random variable.
Discrete Variable
\[E(X) = \sum_{x \in \mathcal{X}} x p(x)\]
Continuous Variable
\[E(X) = \int_{-\infty}^{\infty} x f(x) dx\]
Example
A fair six-sided die has six possible outcomes, each of which is equally likely to occur. The outcomes are the numbers 1 through 6. What is the expected value of the die?
Solution:
In theory,
\[E(X) = \sum_{x \in \mathcal{X}} x p(x) = 1 \cdot \frac{1}{6} + 2 \cdot \frac{1}{6} + 3 \cdot \frac{1}{6} + 4 \cdot \frac{1}{6} + 5 \cdot \frac{1}{6} + 6 \cdot \frac{1}{6} = 3.5\]
Visualizing Expected Value

Visualizing Expected Value
set.seed(42)
n = 100000
x = sample(1:6, n, replace = TRUE)
y = cumsum(x) / seq_along(x)

df = tibble(x = 1:n, y = y)


ggplot(df, aes(x = x, y = y)) +
  geom_line() +
  geom_hline(yintercept = 3.5, linetype = "dashed") +
  ylim(0, 6) +
  theme_minimal() +
  labs(title = "Expected Value of a Die Roll", x = "Number of Rolls", y = "Expected Value")
Law of Large Numbers
- The Law of Large Numbers (LLN) states that the average of the results obtained from a large number of independent identical trials should be close to the expected value and tends to become closer to the expected value as more trials are performed.
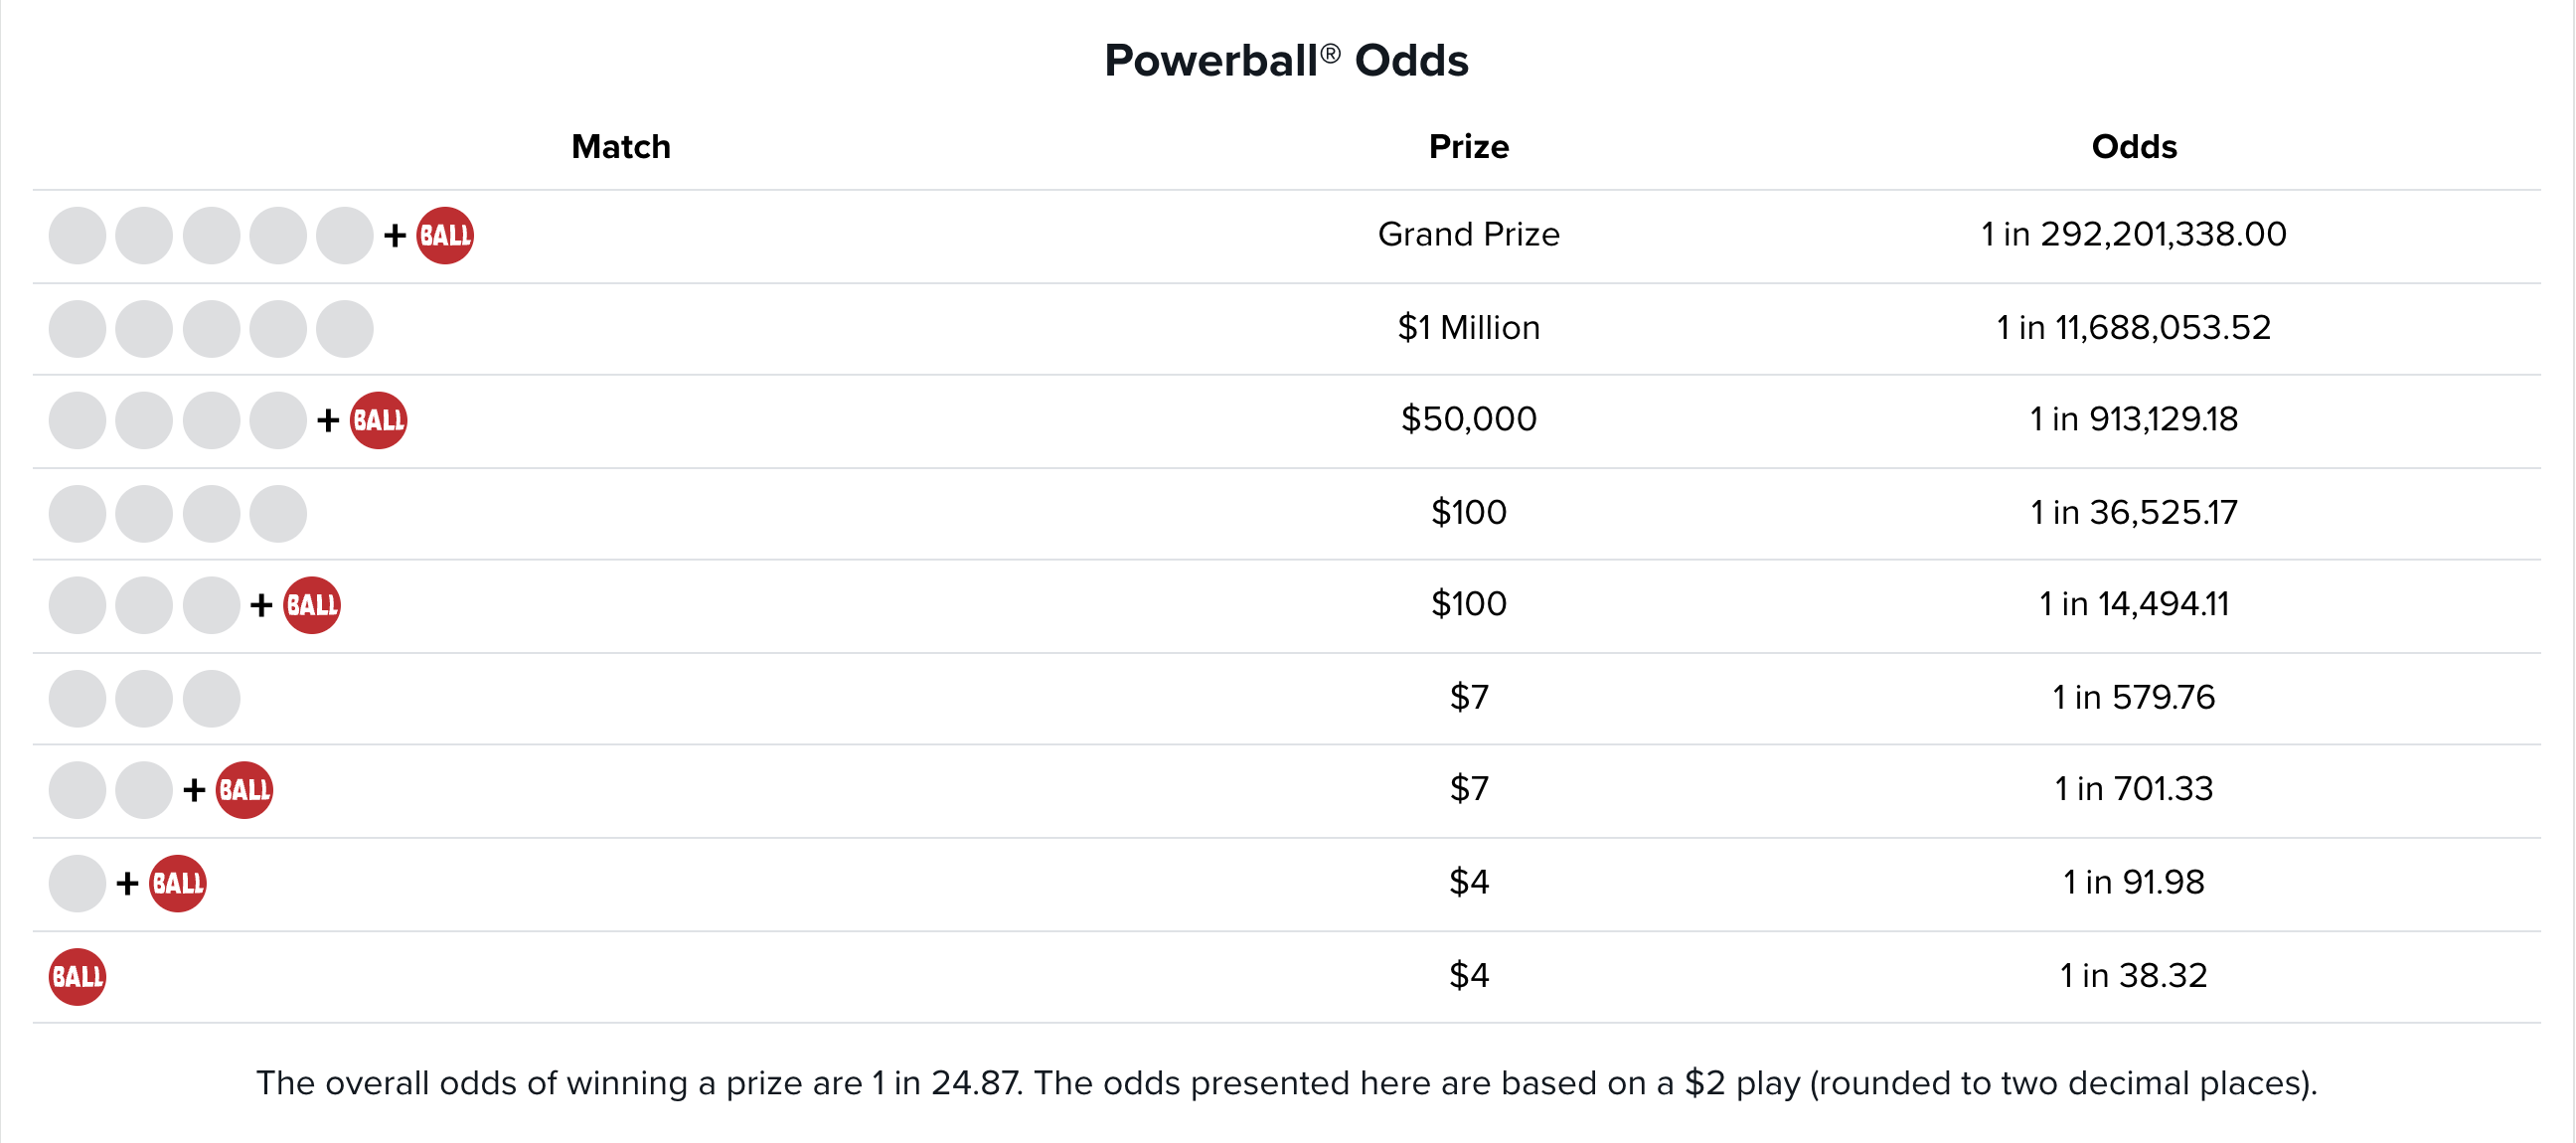
Powerball Odds

Source: https://www.powerball.com/powerball-prize-chart
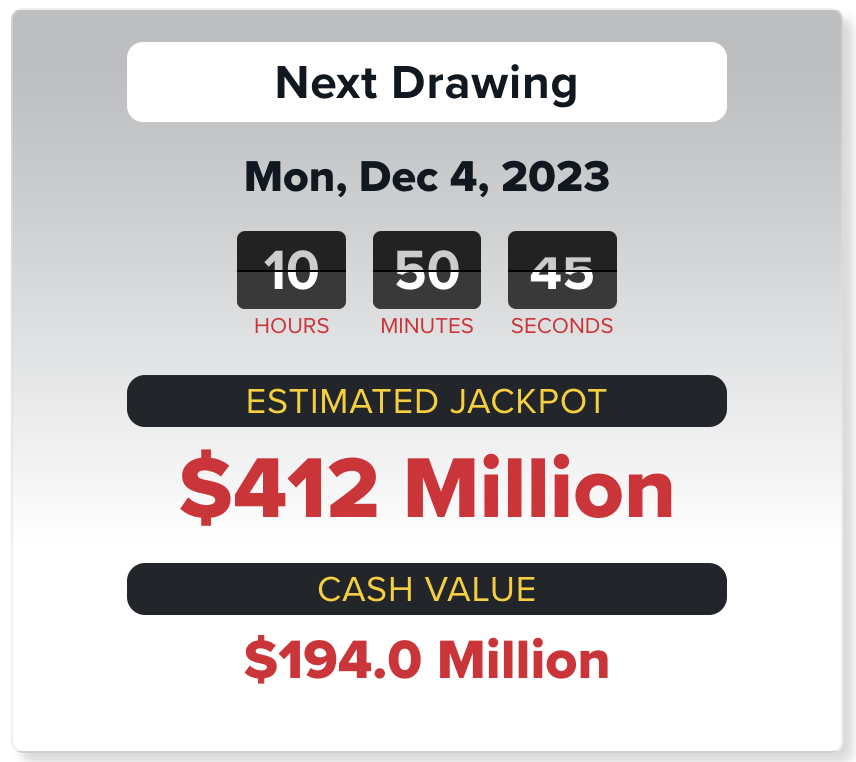
Powerball Jackpot

Source: https://www.powerball.com/
Powerball Expected Value
prizes = c(412000000, 1000000, 50000, 100, 100, 7, 7, 4, 4)
odds = c(1/292201338, 1/11688053.52, 1/913129.18, 1/36525.17,
         1/14494.11, 1/579.76, 1/701.33, 1/91.98, 1/38.32)

print(str_glue("Expected value of a Powerball ticket is ${round(sum(prizes * odds), 2)}."))
Expected value of a Powerball ticket is $1.73.Minimum Jackpot to Play
\[E(X) = y * \frac{ 1}{292201338} + \sum_{x \in \{1000000, 50000, 100, 100, 7, 7, 4, 4\}} xp(x) >= 2 \]
jackpot_odd = 1/292201338
ticket_price = 2

prizes = c(1000000, 50000, 100, 100, 7, 7, 4, 4)
odds = c(1/11688053.52, 1/913129.18, 1/36525.17,
         1/14494.11, 1/579.76, 1/701.33, 1/91.98, 1/38.32)

minimum_jackpot = (ticket_price - sum(prizes * odds)) / jackpot_odd

print(str_glue("Minimum jackpot to play Powerball is ${scales::comma(minimum_jackpot)}."))
Minimum jackpot to play Powerball is $490,933,824.