Unraveling the Confidence Interval Puzzle
From a Single Estimate to a Range
Central Limit Theorem
As the sample size increases, typically when it’s greater than 30, the distribution of the sample means approaches a normal distribution.
Mathematically,
\[\bar X \sim N(\mu, \frac{\sigma^2}{n})\]
where \(\mu\) is the population mean and \(\sigma^2\) is the population variance.
Red Marble Proportion Estimation
library(tidyverse)
source("../utils.R")

red_marble = "🔴"
blue_marble = "🔵"

prob_red = 0.64
num_marbles = 5000 # 1000 -> 5000

set.seed(42)
marbles = sample(c(red_marble, blue_marble), size = num_marbles,
                 replace = TRUE, prob = c(prob_red, 1 - prob_red))

set.seed(42)
n = 100
one_sample = sample(marbles, n)
print(str_glue("Percentage of red marbles: {mean(one_sample == red_marble) * 100}%"))
Percentage of red marbles: 69%- How confident are we in the estimation?
- How can we quantify our level of certainty?
Confidence Interval
“The proportion of red marbles is exactly 69%.”
Confidence Interval
“The proportion of red marbles is exactly 69%.”
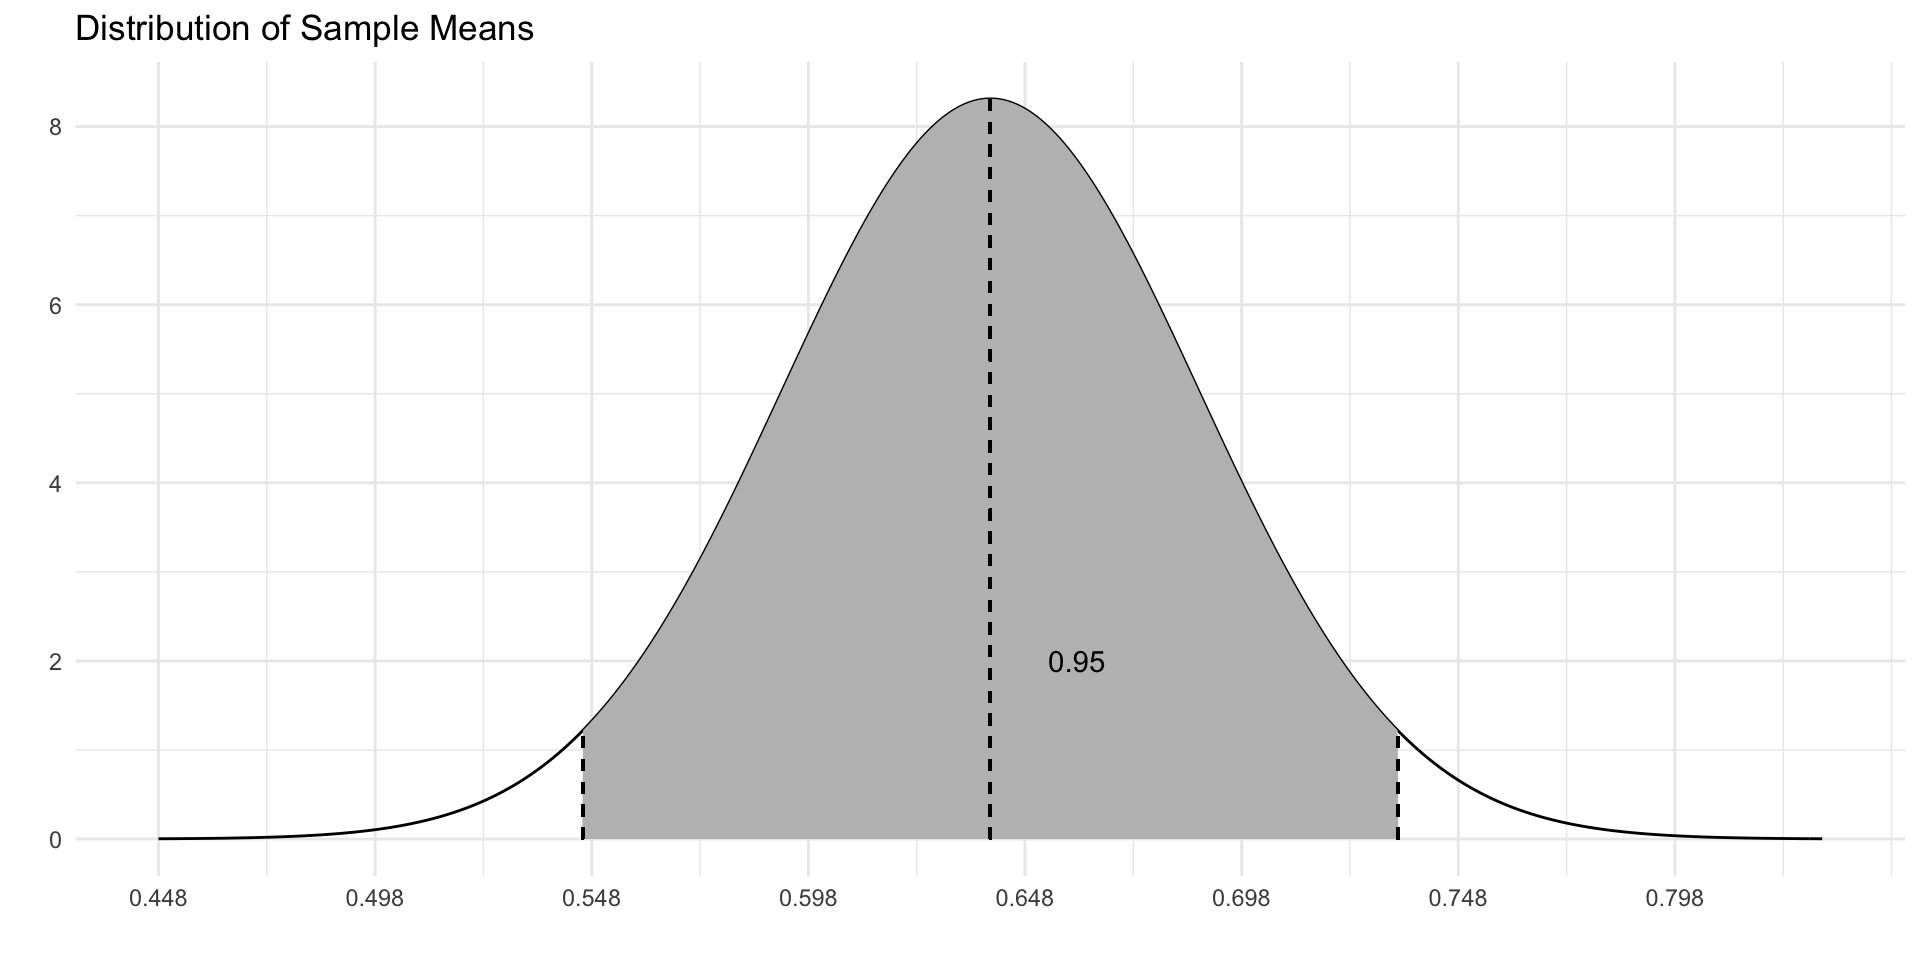
“I am 95% confident the proportion of red marbles in the bag is between 59% and 79%, which is also can be written as 69% \(\pm\) 10%.”
Margin of Error
\[\text{Margin of Error} = \text{Critical Value} \times \text{Standard Error}\]
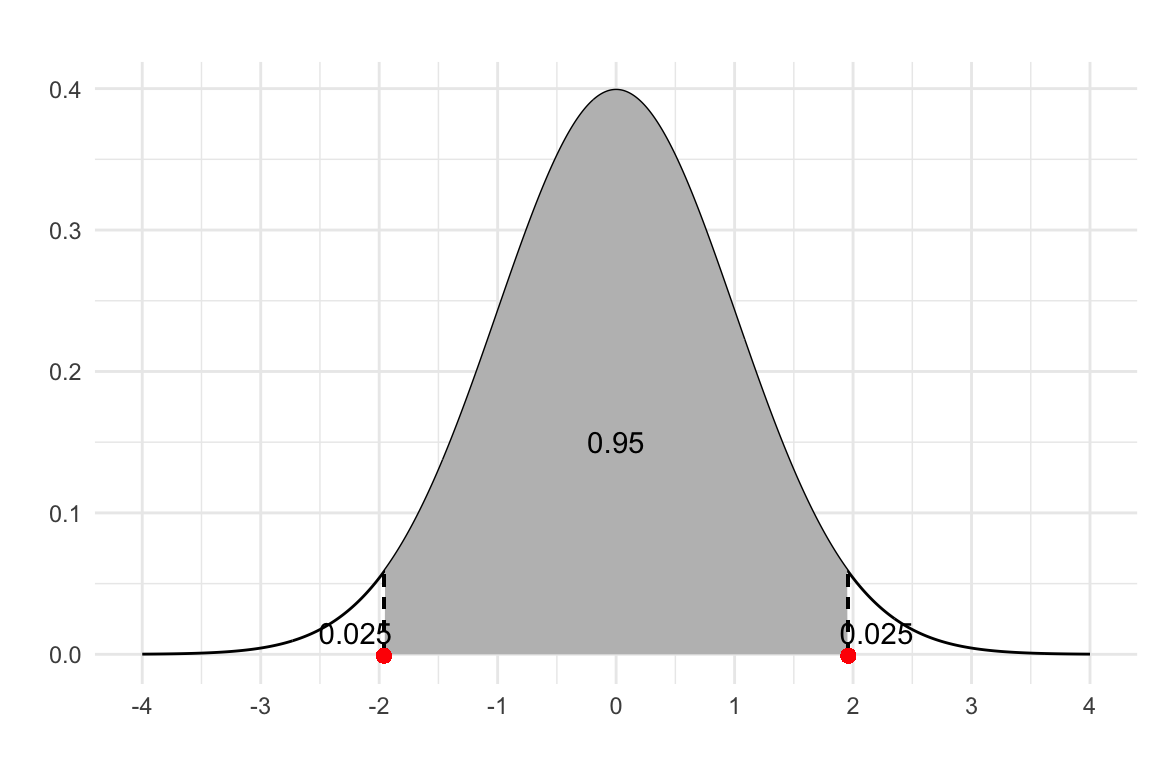
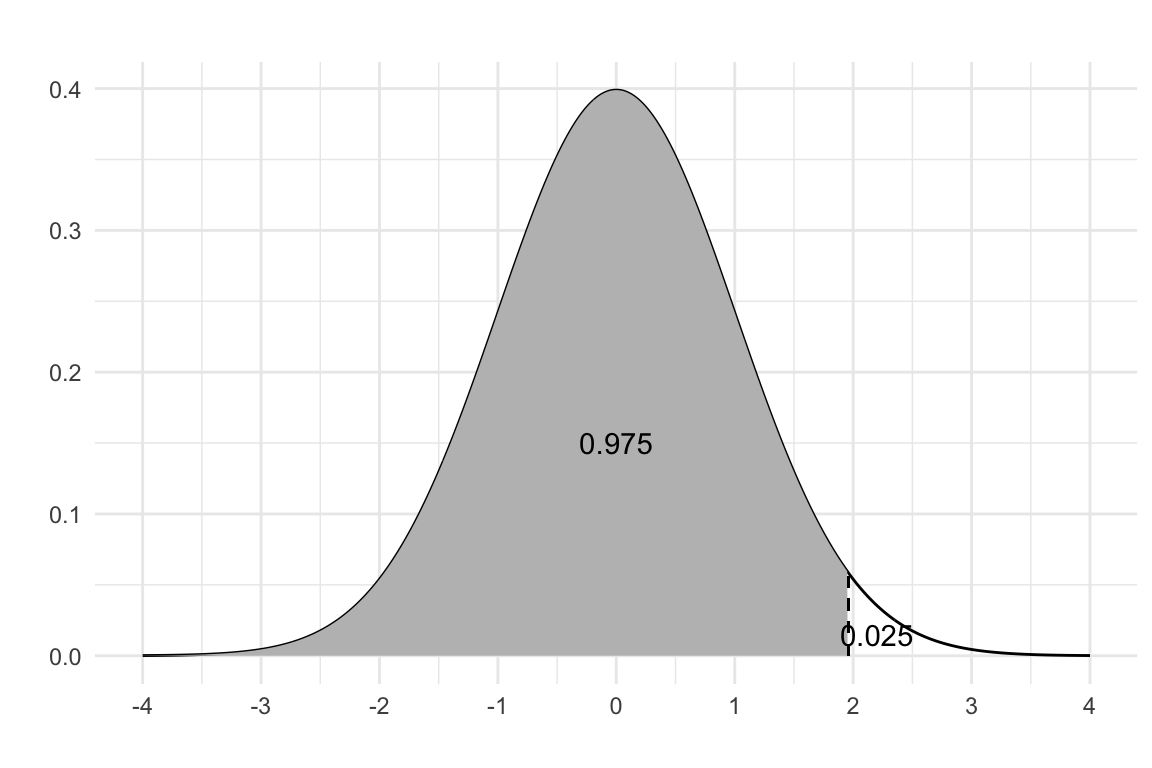
Critical Value (\(z\)-score)
A \(z\)-score indicates how many standard deviations a data point is from the mean of the dataset.
Calculating \(z\)-score
Standard Error
Population Variance Known
\[SE = \frac{\sigma}{\sqrt{n}}\]
Population Variance Unknown
\[SE_{\hat p} = \sqrt{\frac{\hat p (1 - \hat p)}{n}}\]
where \(\hat p\) is the sample proportion.
Margin of Error (MOE)
\[MOE = z \times SE\]
95% Confidence Interval
\[CI = (\hat p - MOE, \hat p + MOE)\]
99% Confidence Interval
How it works?
How it works?
Confidence Level
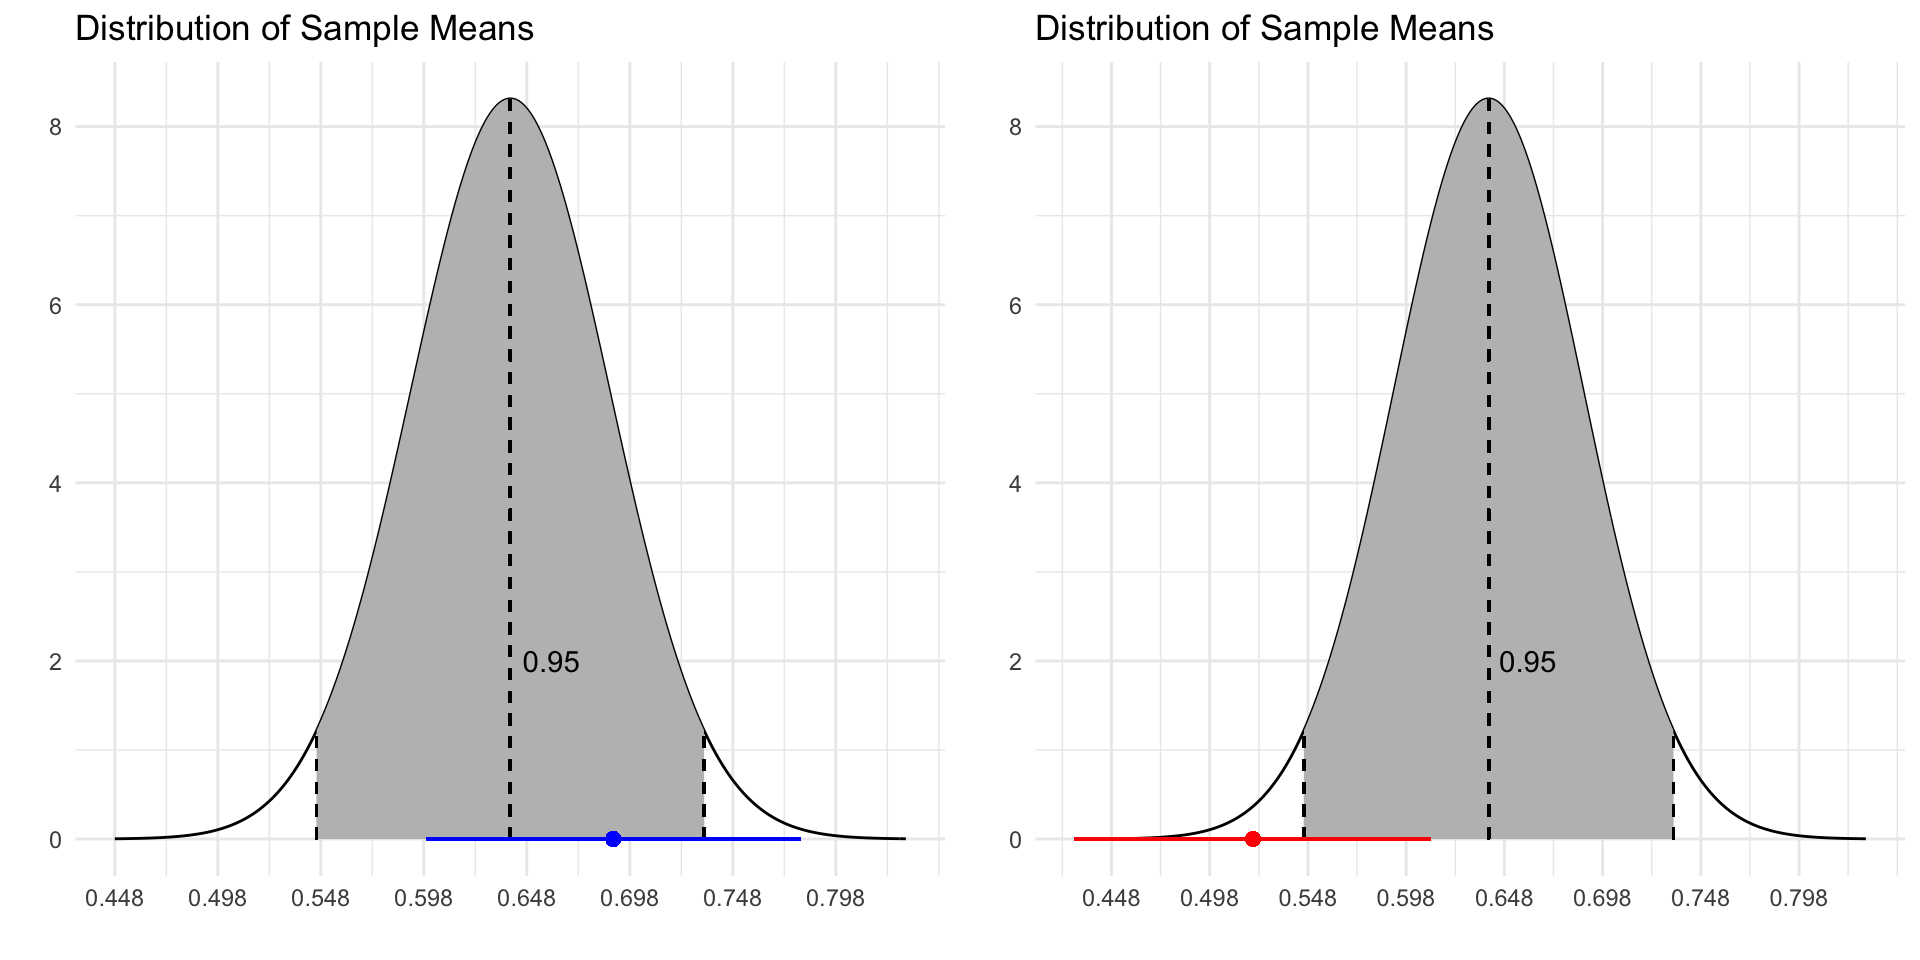
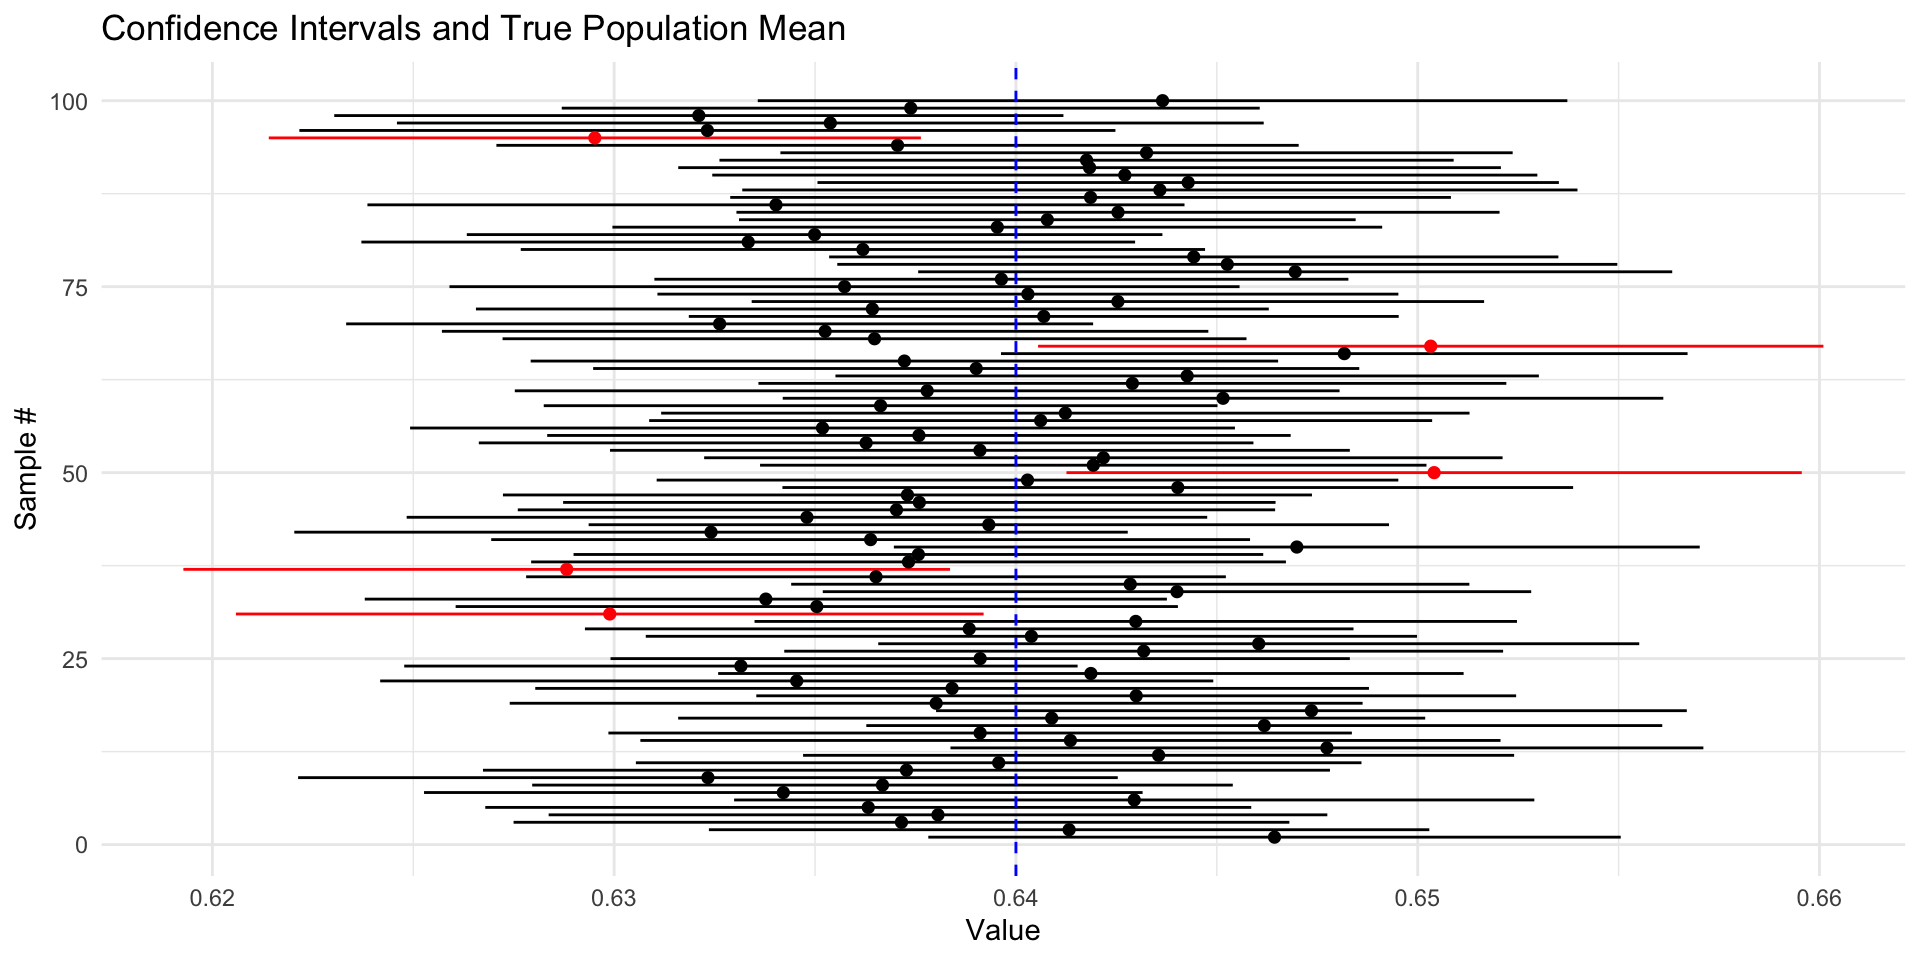
A 95% confidence level means that if we were to take the samples and construct a confidence interval from each sample, we are expecting that the intervals would capture the true population mean about 95% of the time.
95% Confidence Level
Steps for Constructing CI
- Compute the sample proportion, \(\hat p\)
- Find critical value, \(z\), corresponding to the confidence level
- Compute the standard error, \(SE = \sqrt{\hat p (1 - \hat p) / n}\)
- Compute the Margin of Error, \(MOE = z\times SE\)
- Construct confidence interval, \(\hat p \pm MOE\)
Question
“Half of the marbles in the bag are red!”